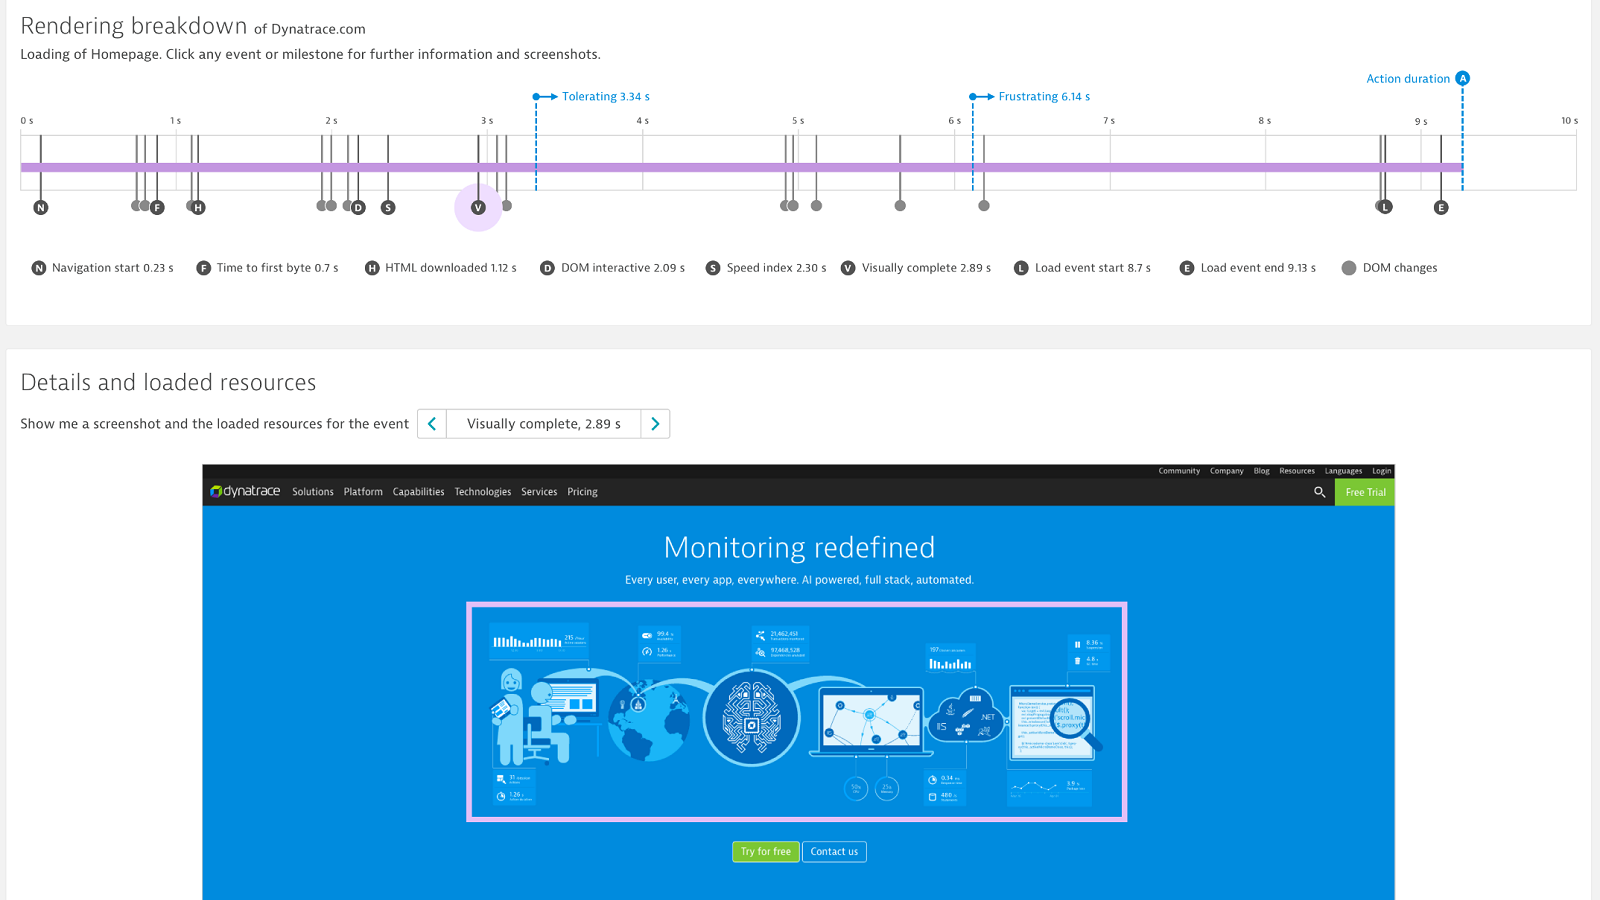
Real user speed index and visually complete
This is a somewhat personal post today. I’m currently in Las Vegas (which would be a story on its own) to speak and attend our company’s Perform conference. Why me, as a mere web developer with no customer contact? First, I do like to bring the developer’s view into the whole mix. Second, I want to see the birth of a new product feature.
What is my role in this part? Well, I came to Dynatrace almost two years ago. And with every job switch you have a lot of expectations and also your own personal agenda you bring with you. Back in the day I was strongly advocating metrics like Speed Index and visually complete (I still do). Metrics that our products did not feature back then, but would have helped me a lot in my daily work. And I was nagging a lot. And complaining a lot. And teasing the right people … alot!
I almost felt if I’m not welcome because of my attitude (being a bit cocky at times), but I was totally wrong. My colleagues just loved to have a new challenge! Now, almost 2 years later, we have Speed Index and visually complete available in our products. Not only that, but we have it available through real user monitoring as an industry first.
And this is what I totally love about this company. I am able to work with the brightest minds and really innovate something. Pushing the boundaries of what’s possible and seeing those clever people putting their minds together to create a simple as well as powerful solution for getting real user speed index is one of the best experiences I had so far. When I got the demo about 4 months ago, I was in awe on what my colleagues have achieved.

I won’t go into the details here, the product page and this blog post are doing that. I just wanted to say that I’m happy :-) (and maybe a little proud).